Mission
Explore how multimodal physiological data can provide can provide insight to assess pilot training needs, by developing AI-based solutions to predict individual cognitive state and operational performance.
Background
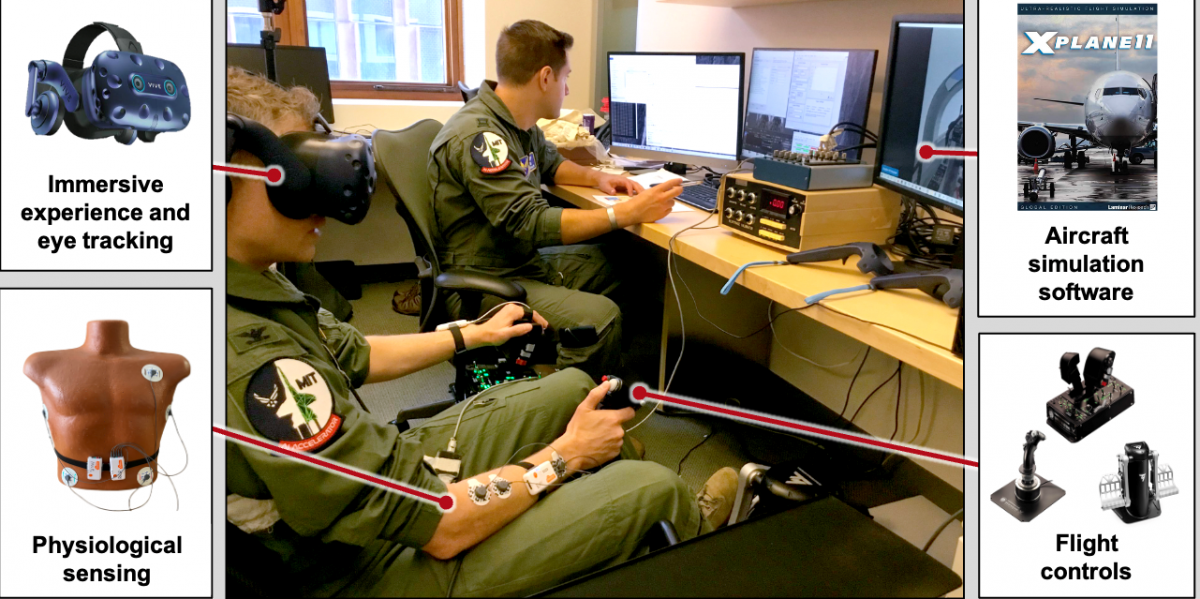
Figure 1. Data collection via physiological measurements recorded during immersive VR flight training simulations.
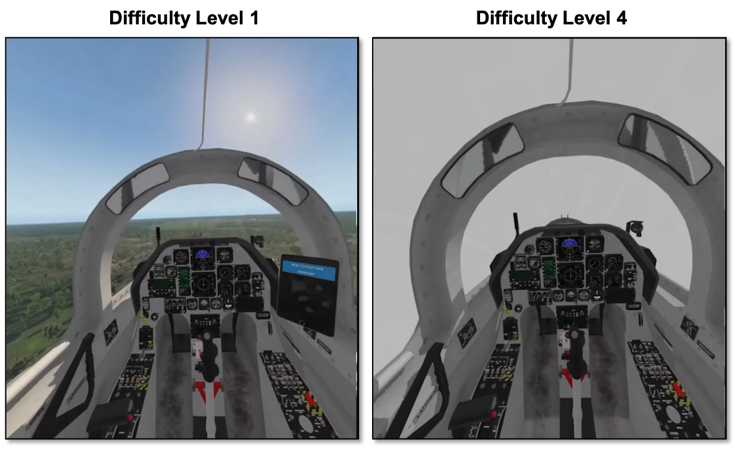
Figure 2. Flight simulations were designed to span four levels of difficulty. Shown here are screenshots from the easiest (left) and most difficult (right) levels.
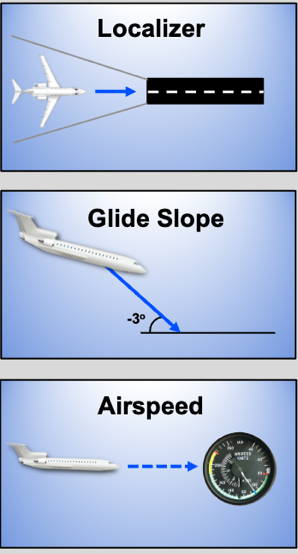
Figure 3. Measures of Flight Performance Error shown here were summed and aggregated over each flight simulation run to obtain Cumulative Flight Performance.
We have created an immersive virtual reality (VR) training environment (Figure 1), which allows us to replicate the pilot training experience while supporting multimodal data collection, including eye tracking, behavior, and physiological measurements (https://physionet.org/content/virtual-reality-piloting/1.0.0/). The VR immersion is implemented using an HTC Vive Pro Eye headset with built-in eye tracking capability. The simulation software engine is X-Plane 11, with the T-6A Texan II fixed wing trainer aircraft as the model aircraft. The simulated aircraft is flown using a pendular rudder and hands-on throttle-and-stick.
The full simulation presents a series of Instrumented Landing System (ILS) approaches and landings across four levels of difficulty (Figure 2). During each training run, the aircraft must be landed while maintaining tight lateral tolerances, elevation tolerances, and airspeed (velocity) tolerances. During a flying session, a subject performs 12 ILS runs with three iterations of each difficulty level, presented in a counterbalanced sequence. Flight performance is quantified using three criteria (Figure 3):
- Localizer Error: horizontal deviation from the straight line to the runway
- Glide Slope Error: deviation from the required angle of descent (-3 degrees)
- Airspeed Error: scaled deviation from the required constant airspeed through landing (104 knots)
These measures are recorded continuously throughout each flight simulation run, absolute instantaneous values are summed, and aggregated over each run to obtain the subject’s Cumulative Flight Performance during that run.
All physiological signals were time-synchronized using the Lab Streaming Layer to support multimodal analyses. The development dataset, together with data dictionary and Python starter code, can be downloaded from PhysioNet.
CogPilot Data Challenge 2.0 Tasks
- Task 1: Classify the difficulty level (1-4) of a flight simulation run using only physiological metrics. This task will be evaluated using F1 score and Area Under the ROC Curve (AUC) to assess classification accuracy between predicted and actual difficulty level.
- Task 2: Estimate the pilot’s Cumulative Flight Performance during a flight simulation run using only physiological metrics. This task will be evaluated using a combination of Root Mean Squared Error, Pearson Correlation, and Spearman Correlation to assess accuracy of estimated Cumulative Flight Performance values relative to actual values.
While not required, we encourage teams to consider how the developed models could be operationalized to real-world cockpit use (e.g., building models using data from only a subset of sensors).
The CogPilot Data Challenge 2.0 builds upon first CogPilot Data Challenge (2021) by increasing the development dataset from 15 to 35 participant to build the AI models. The Challenge Tasks remain the same for the CogPilot Data Challenge 2.0.
Process
To enable objective assessment of submitted solutions using held-out data, we have subdivided the dataset into development and evaluation subsets by subject. Ground truth labels are provided only for the development set, to allow for training and validation of your predictive models.
Step 1: Download the data: https://physionet.org/content/virtual-reality-piloting/1.0.0/
Step 2: Develop your feature engineering and feature selection strategies; process the data accordingly
Step 3: Train and validate your AI model using the development subset of the data. Adjust as needed to improve performance.
Step 4: When you are ready to submit your solution for adjudication, run your AI model on the evaluation subset of the data
Step 5: Prepare your submission package: your evaluation set predictions, completed questionnaire document, and executive pitch video summarizing your solution.
Step 6: Fill out our submission form and upload your submission package using the emailed Dropbox file request link.
Adjudication
The submitted evaluation set predictions will be assessed in relation to ground truth values using the evaluation metrics for the corresponding task, as detailed in Table 1. Each newly submitted solution for a given task will be ranked against the current leaderboard according to the evaluation metrics for that task. The average of the ranks across all of the task’s evaluation metrics will determine the overall ranking for the new submission.
Table 1. Evaluation Metrics by Task
|
Task |
Evaluation Metric |
Rationale |
|---|---|---|
|
Task 1: Classify Difficulty Level |
Area Under the ROC Curve (AUC) |
|
|
F1 Score = 2 (precision * recall) / (precision + recall) |
|
|
|
Task 2: Predict Performance Error |
Root Mean Squared Error (RMSE) |
|
|
Pearson Correlation |
|
|
|
Spearman Correlation |
|